
CIVIC SAFETY | PUBLIC SECTOR
Making public safety data easy for all to access.
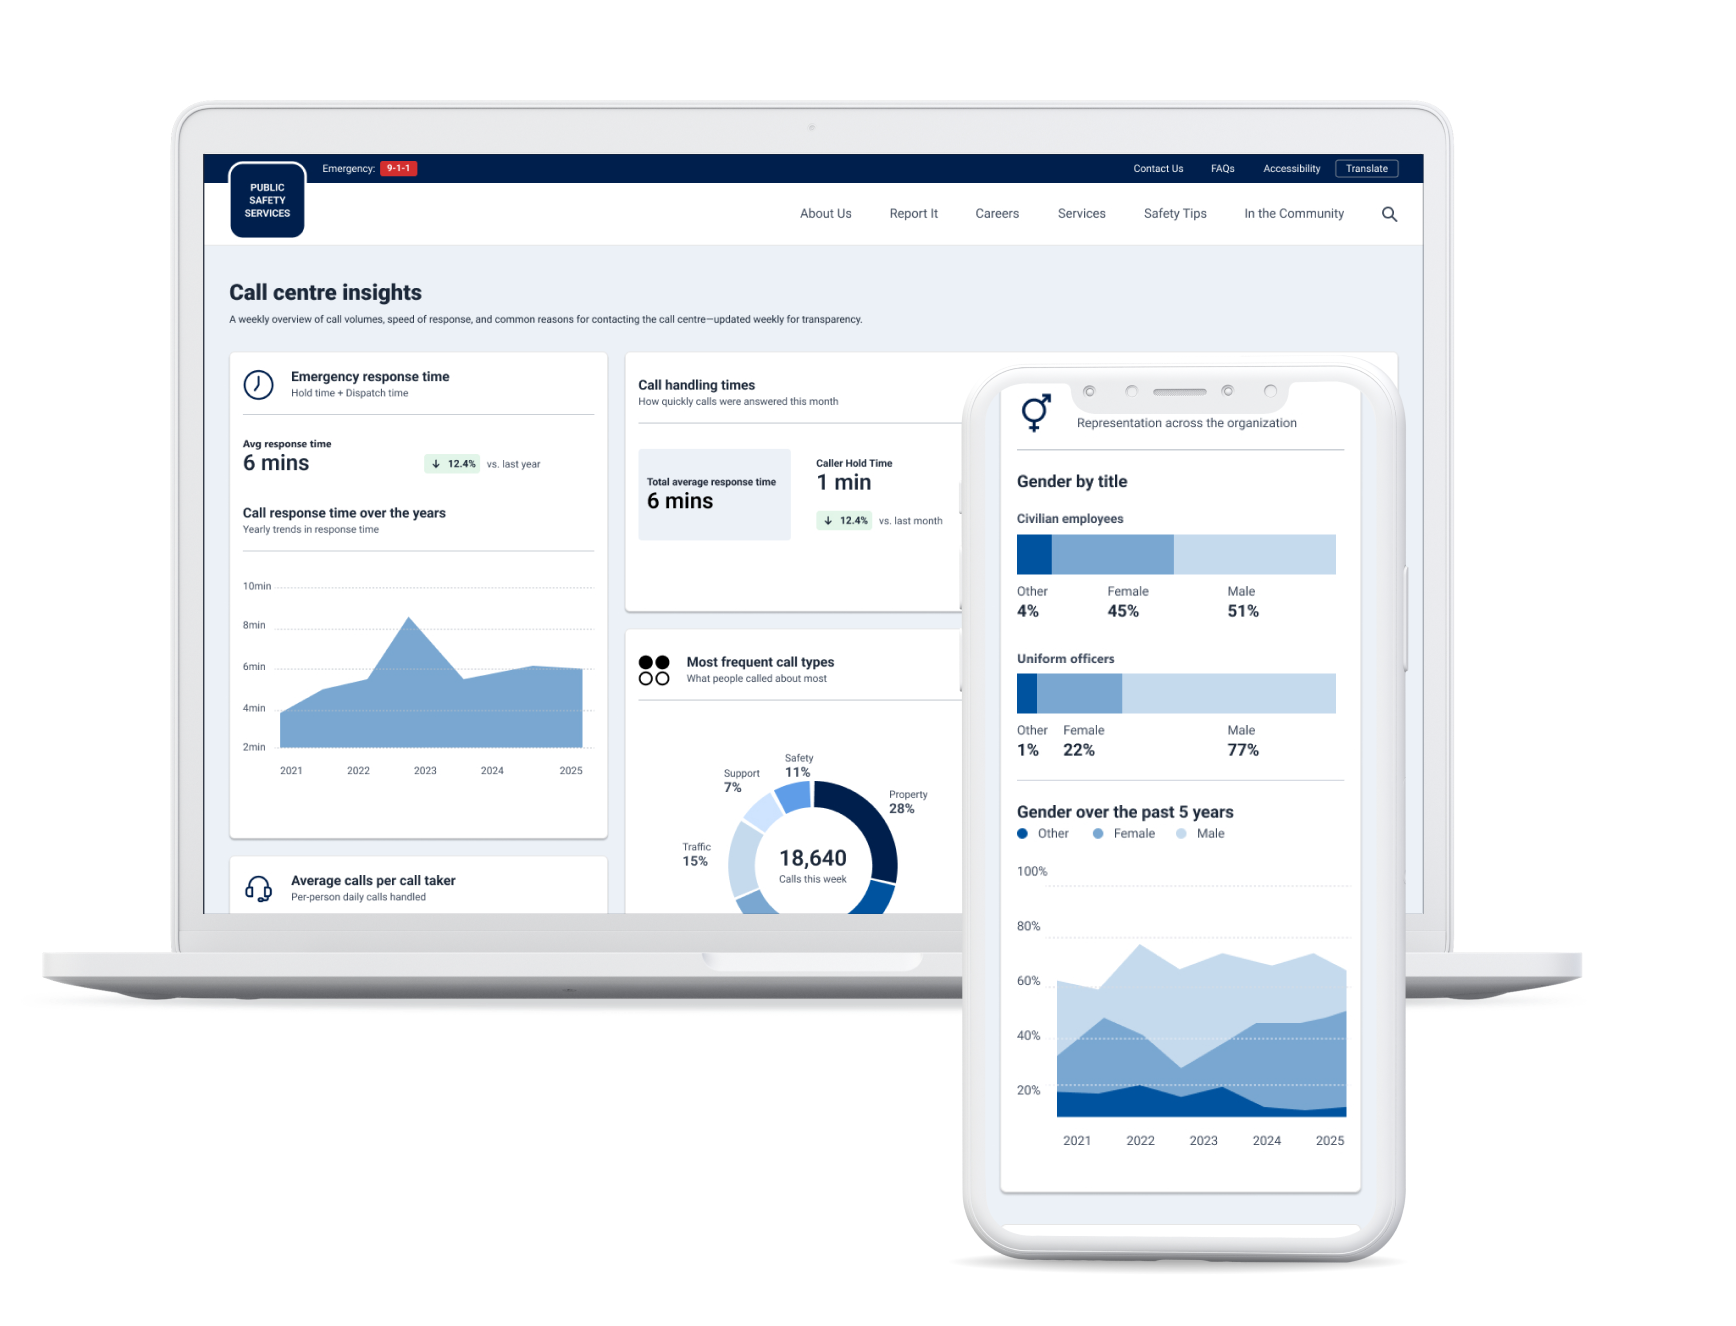
A set of public-facing dashboards that help the community understand incident trends, emergency response times, and the workforce that serves their community. Designed in three weeks, on a project that hadn't accounted for design at all.
Client details have been removed to protect client NDAs.
The Brief
Design was an afterthought, and I had three weeks to make it count.
The client wanted a unified space where residents could see what was happening in their region: how much crime was being reported, how quickly emergency calls were answered, and what the employee make up of the organization was. The dashboards would be built in Power BI as part of a larger data engagement, and the platform had to keep growing to accommodate new information updates.
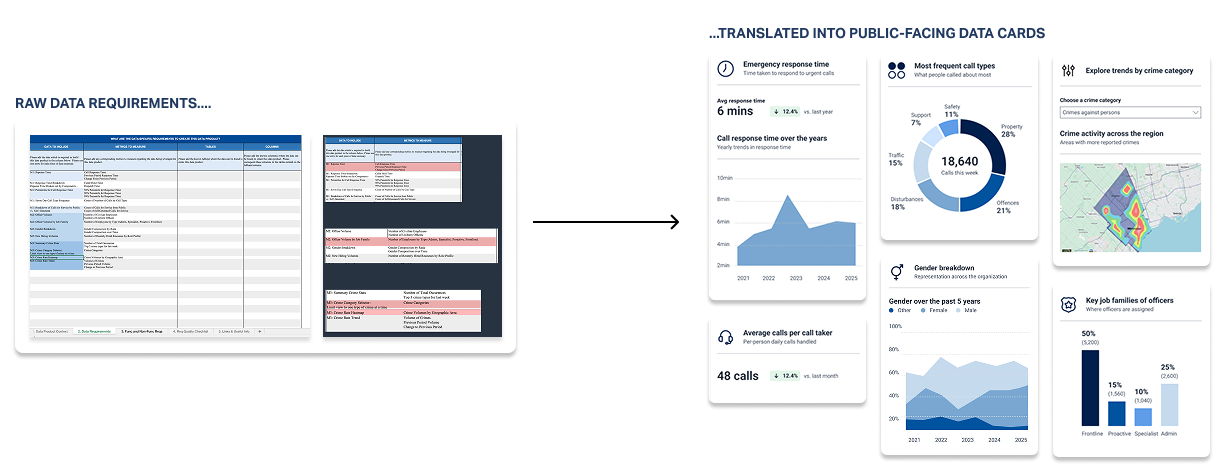
Late in the project, the team realized no one had accounted for designing the user experience. What existed was a requirements spreadsheet listing data and metrics. My job was to turn it into something the public could use, and something developers could build without me.
My role: Lead UX & Visual Designer
Platform: Microsoft Power BI
What I did: Requirements mapping, sketching, wireframing, stakeholder reviews, visual design, style guide for development handoff
Duration: 3 weeks

What was needed
Every metric had to make sense to the community.
The requirements listed each metric the way an analyst would: response time percentiles, calls for service by source, officer volume by job family. Few in the community would know what those terms mean. For each metric, I worked out what a resident would actually want to know, then designed the card around that answer.
A few decisions carried across all three dashboards:
01/ Plain language on every card.
Every chart has a one-line description under its title, so residents know what they're looking at before reading the numbers.
02/ Clear indicators to mark changes
To enhance accessibility, changes are highlighted not just through colour but with labels and arrows too.
03/ Filters preselected on page load.
Category filters load with the first option already selected, so people land on real data and the charts are never blank.
04/ Mobile friendly design.
Many residents will check this on their phones, so cards stack in priority order, with the key figures first.

The Process
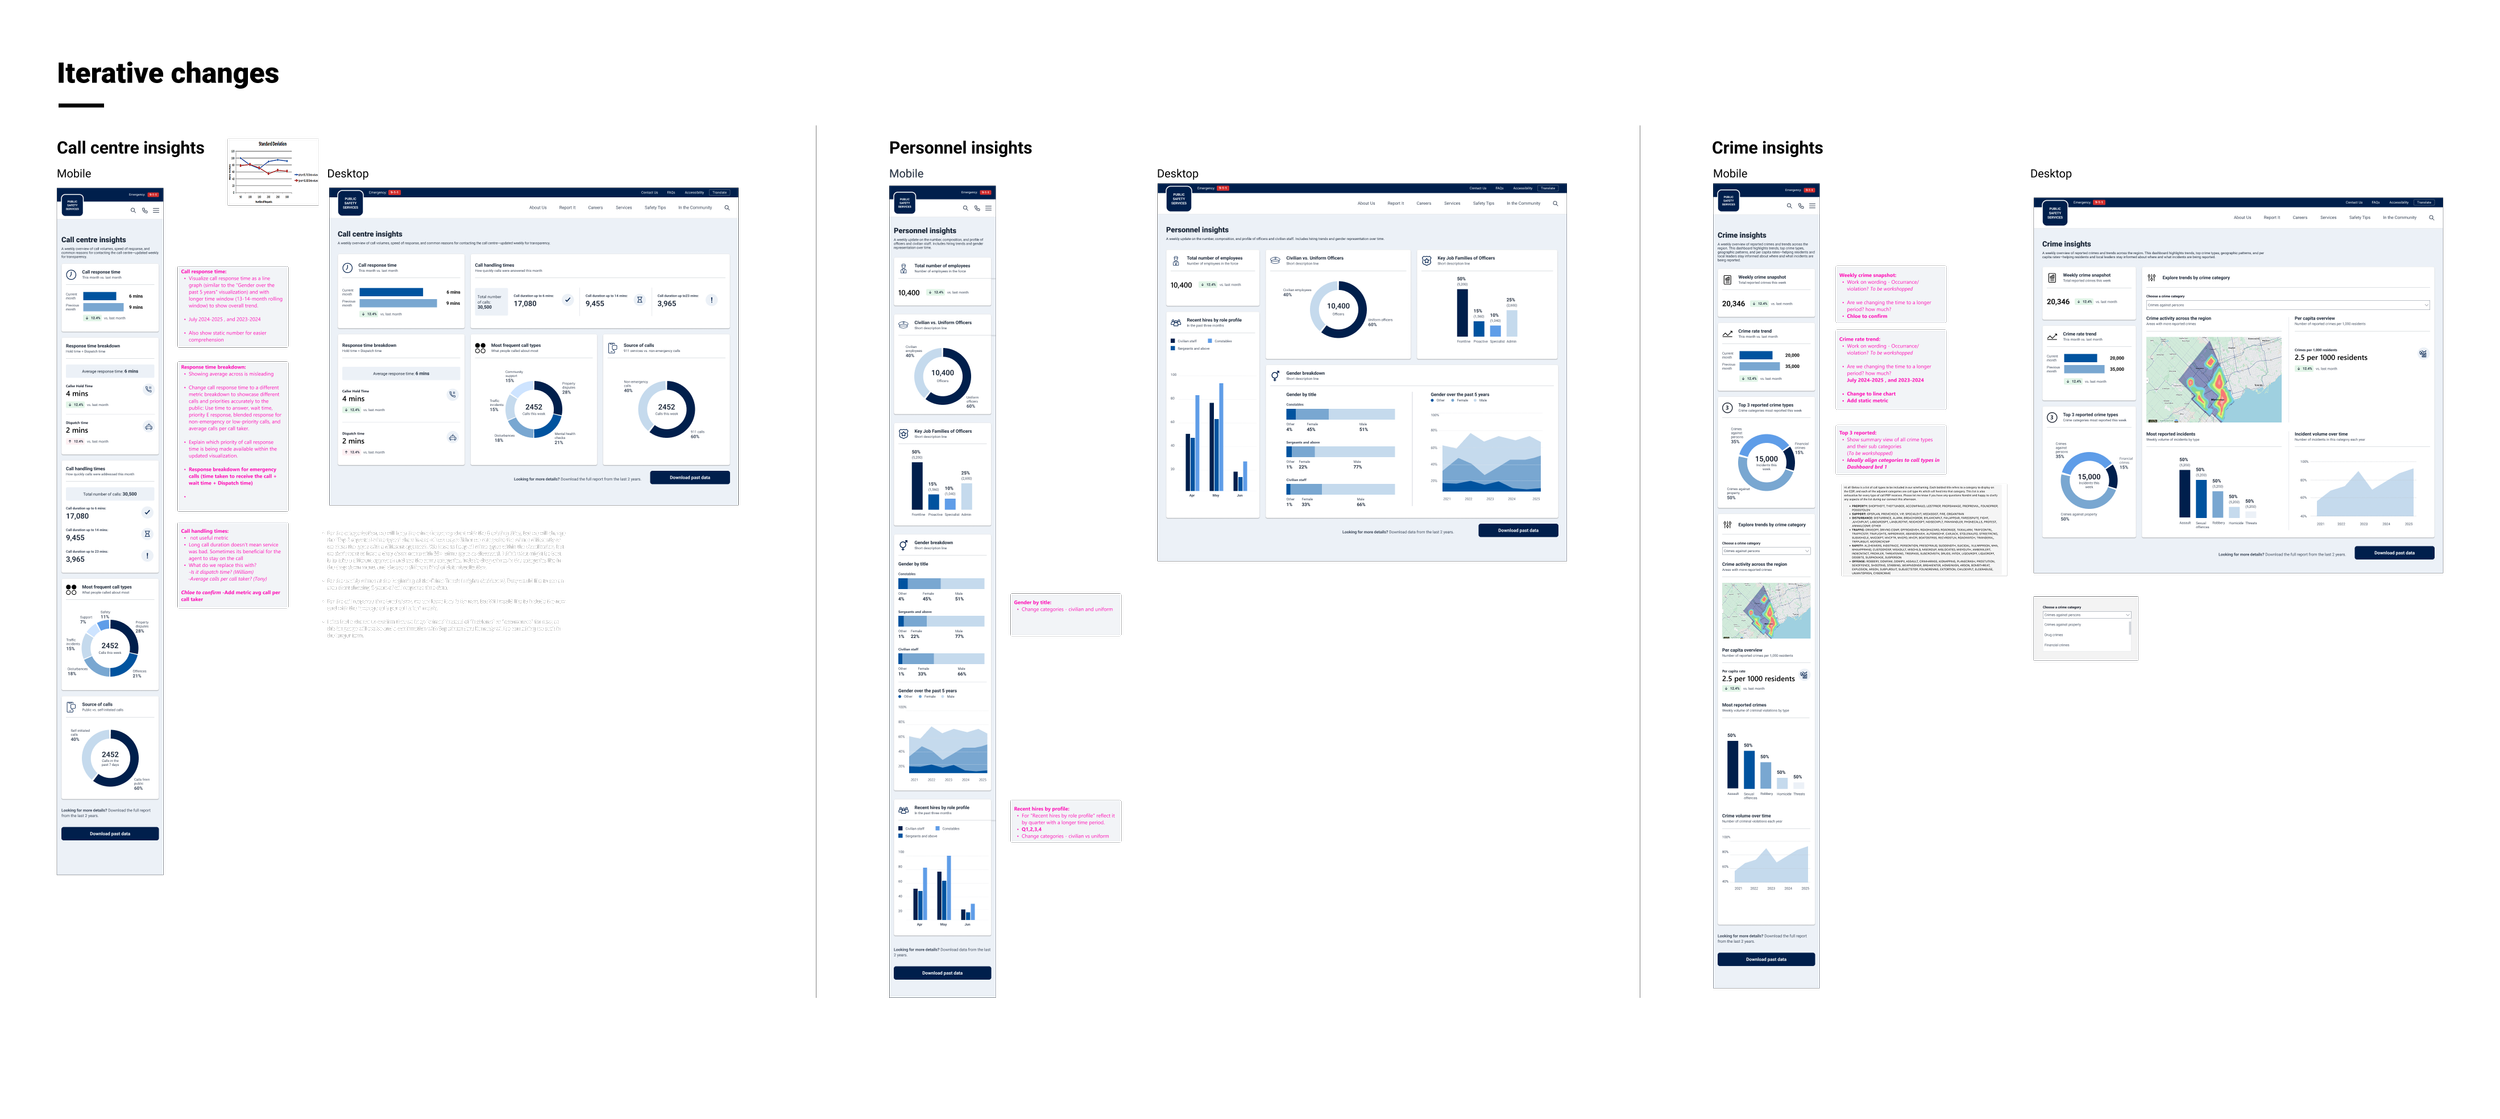
Eight rounds of iteration in three weeks.
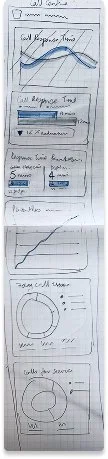
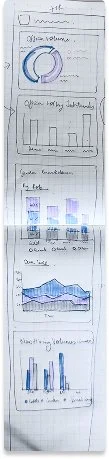
Given the tight timelines, waiting days for feedback wasn't an option. To keep things moving, I set up daily half-hour syncs with stakeholders. These power syncs gave the project a steady rhythm, so feedback that might otherwise have taken days came back within hours.
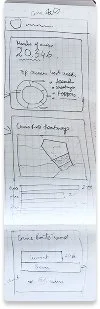
That rhythm carried the work from hand sketches through wireframes, visual design and the final handoff, in eight rounds. Because decisions were made every day, nothing piled up and open questions were settled early on.
The Work
Three dashboards that build transparency with the community.
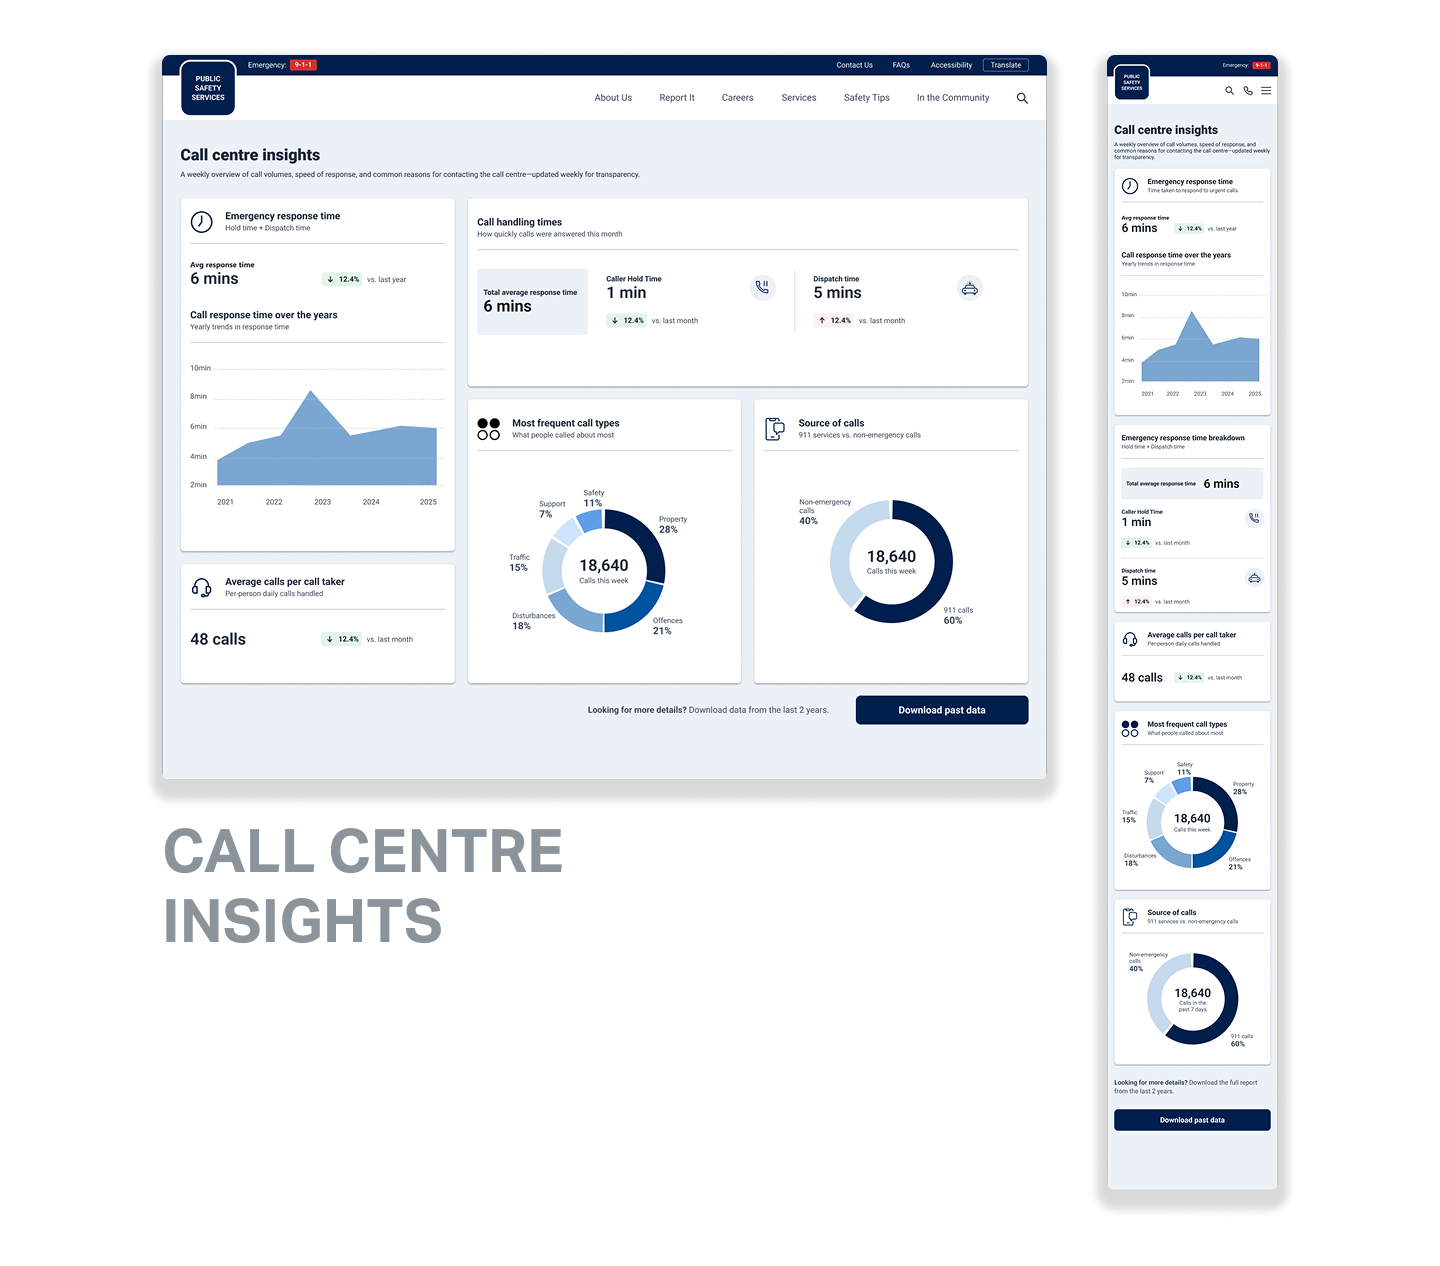
01/ Call Centre Insights
Emergency response time broken into hold time and dispatch time, plus call volumes, the most common reasons people call, and where calls come from.
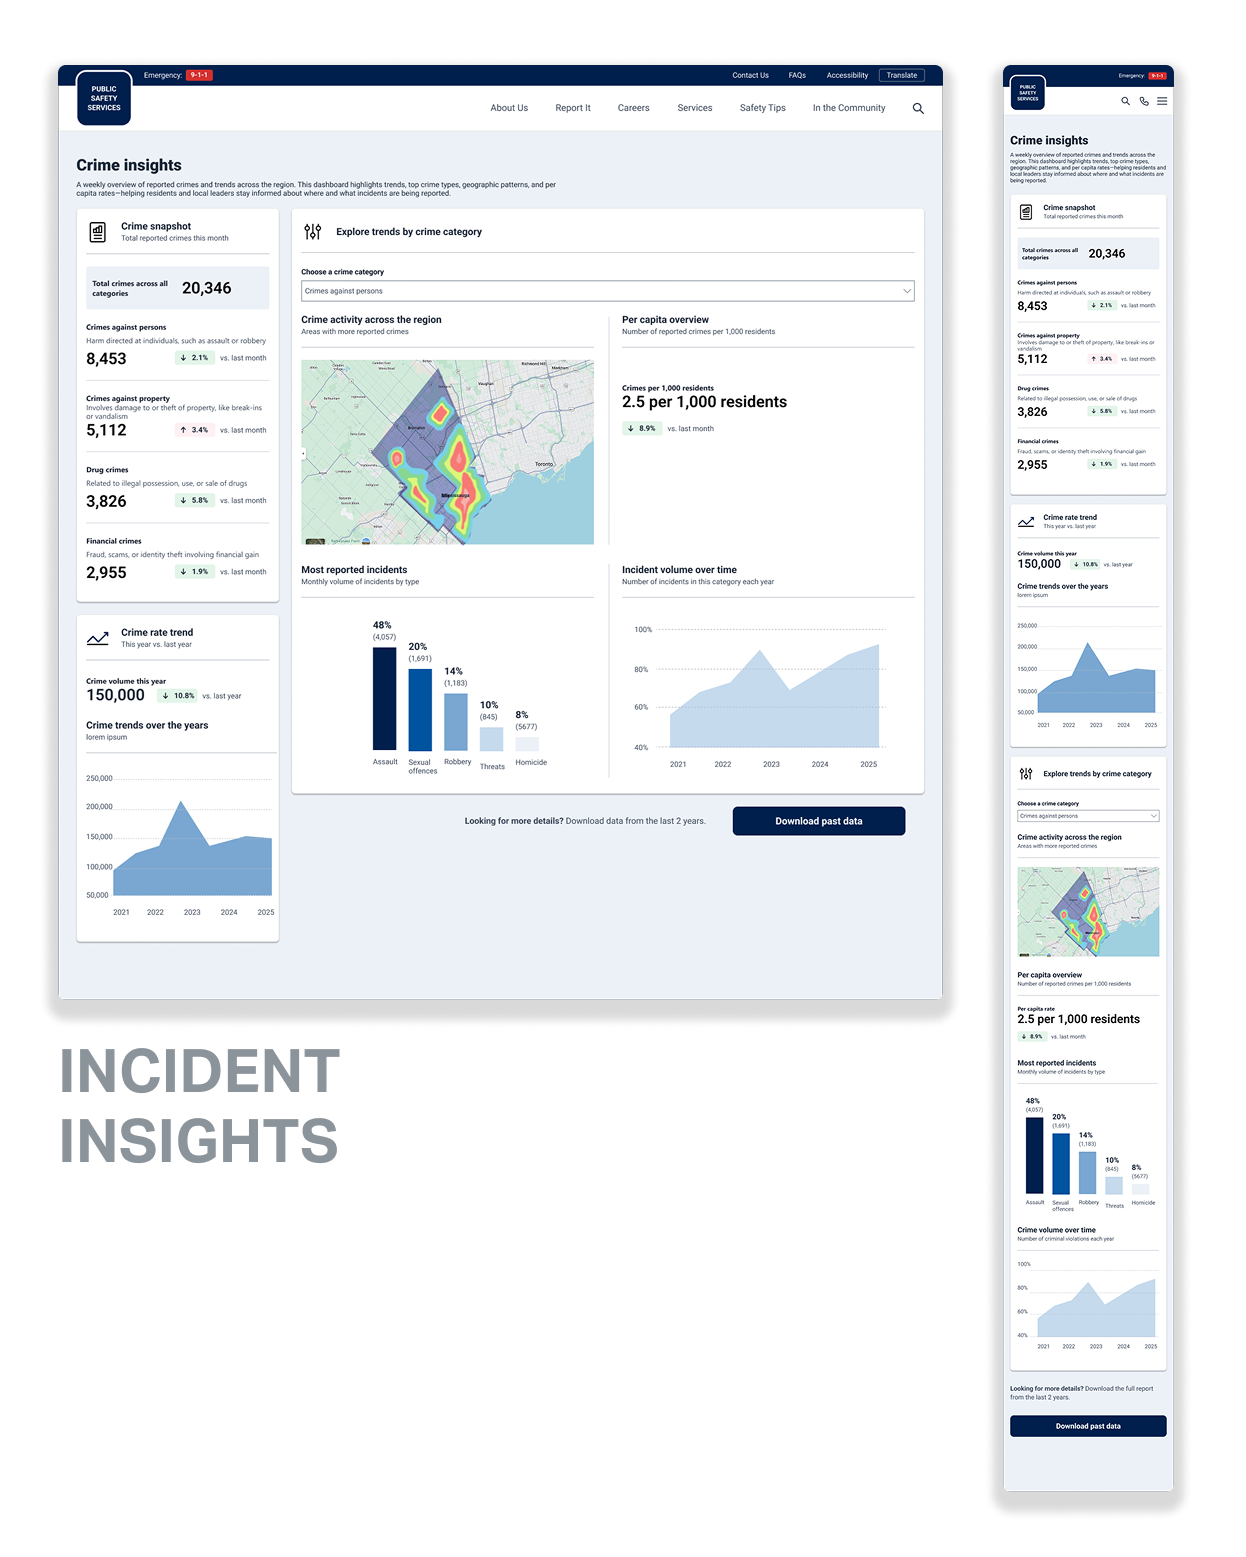
02/ Incident Insights
Reported crime by category, five-year trends, and a filter to explore one category at a time: where it's happening, the rate per 1,000 residents, and the most reported incident types.
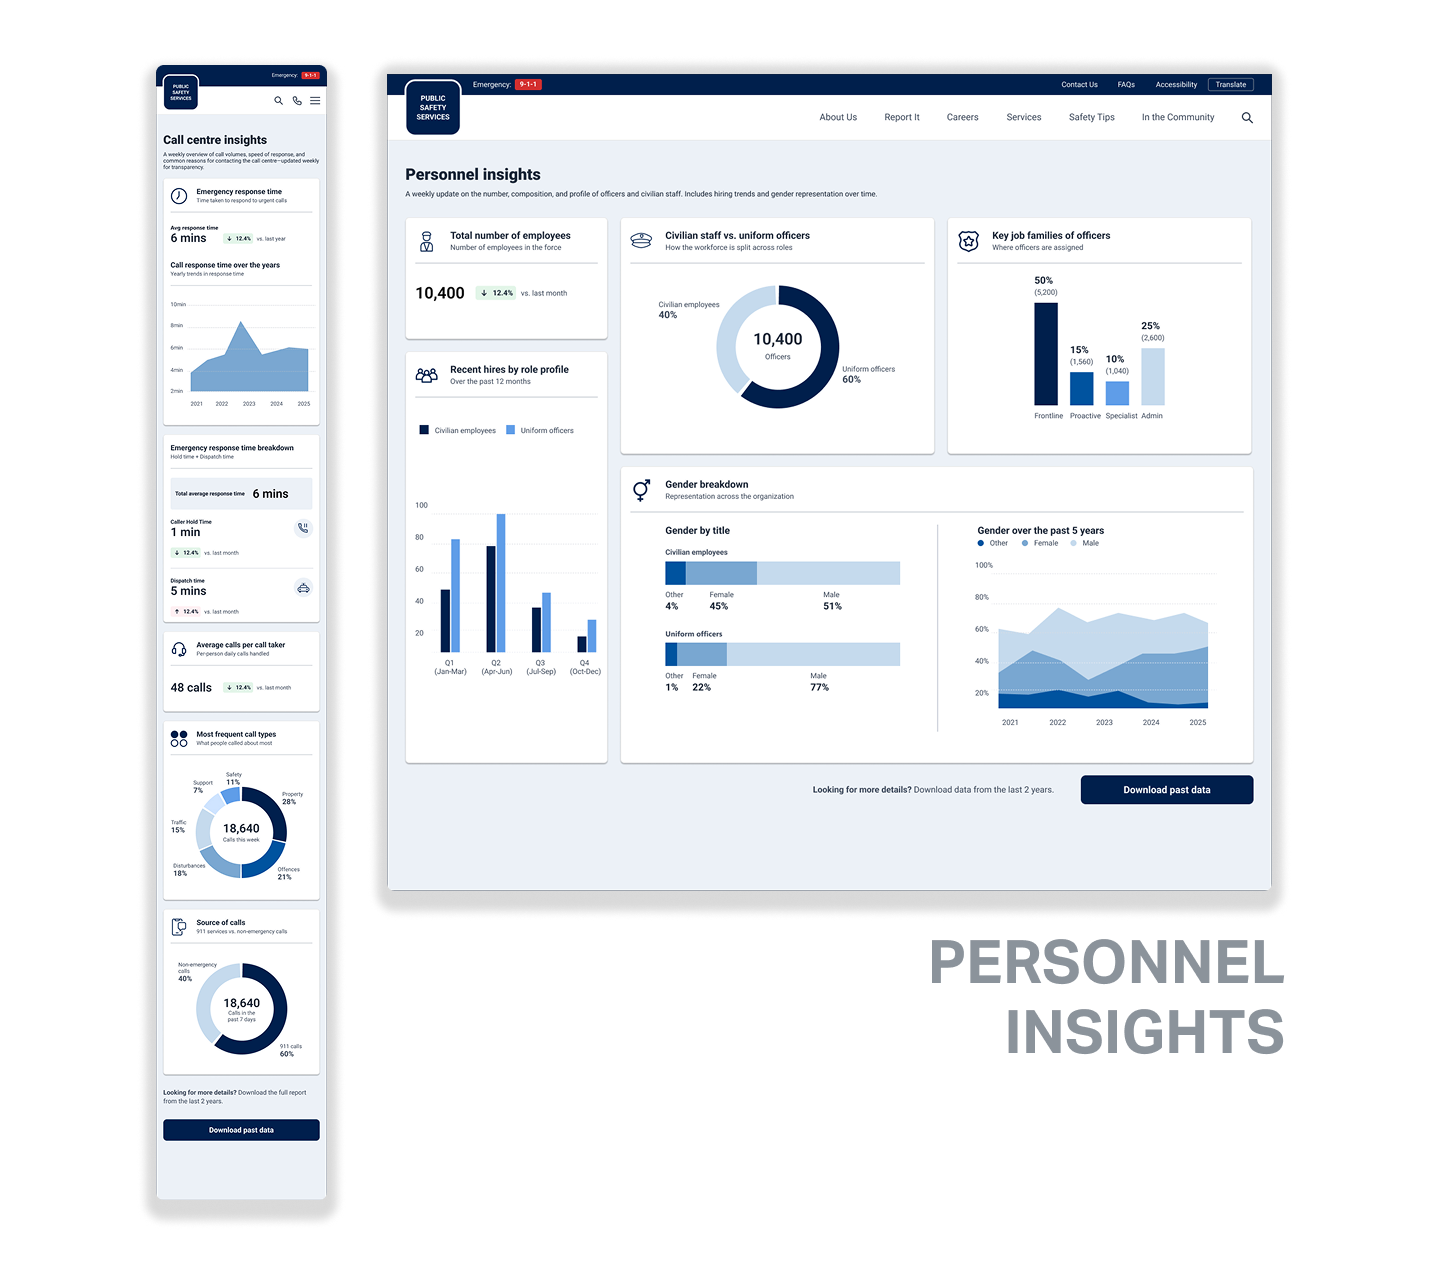
03/ Personnel Insights
Reported crime by category, five-year trends, and a filter to explore one category at a time: where it's happening, the rate per 1,000 residents, and the most reported incident types.
Constraints
Designing for a build I would not be a part of.
Once I handed off, a separate team would build everything in Power BI. To ensure the designs acted as more than just a mock-up, and be something developers could use as the backbone for their work, I put in place a few guardrails:
Designing inside Power BI's limits from day one.
Every chart type came from Power BI's native options, so what I designed is what got built.
A style guide that did the explaining for me.
It defined a role for every colour, a single type scale, card anatomy and spacing, when to use each chart type, iconography, and grids for desktop and mobile.
Where it landed
The dashboards are live on the client's public website, turning internal operational data into something the community can easily understand and trust.
The style guide gives the client a system for managing content and presenting new information to the community, while keeping everything clear and consistent.
The project also showed what design can add to a Microsoft-ecosystem engagement, and how it can act as a trusted partner.